How to Monitor Kafka Consumer Lag From Java Services
Compute Kafka consumer lag with the AdminClient, export it as a Micrometer gauge, set time based alerts and learn what a growing lag really means.
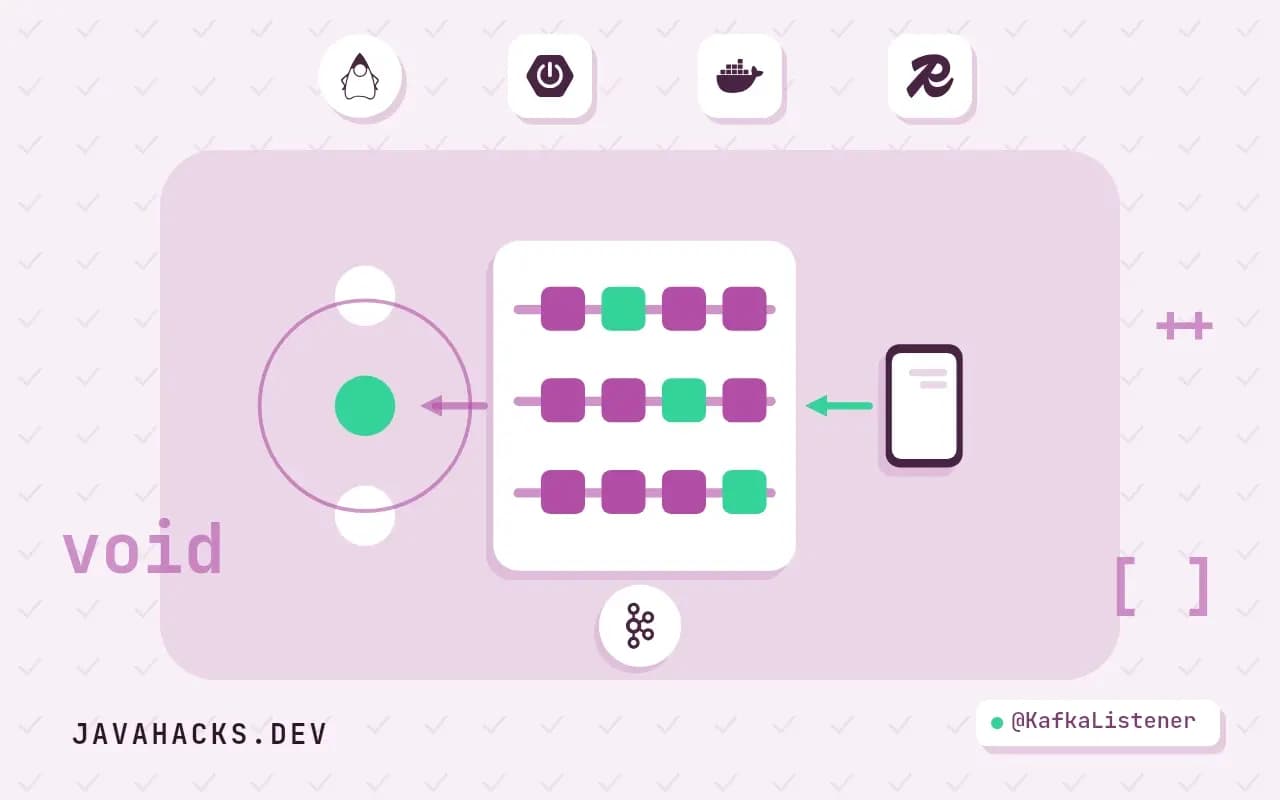
A consumer group that is healthy has lag near zero. When the number starts climbing, something is wrong: processing is slower than arrival, a consumer died, a rebalance is looping or a downstream dependency is stalling the handler. The metric is therefore the best single health indicator for a Kafka based service, and it is cheap to compute. This post builds a lag monitor in Java with the AdminClient, exports it with Micrometer, shows the alerts that work and the readings that mislead. For the reasons lag grows and the settings that control it, see configuring Kafka consumers for back pressure. Related reading: Kafka rebalances and offsets and Prometheus and Grafana for Java services.
What lag is
Each partition is an append-only log with offsets 0, 1, 2 and so on. Two numbers describe where a consumer group stands on one partition:
- The log end offset, the offset that the next produced record will get. Its value is one more than the latest record.
- The committed offset, the position the group last committed, meaning the next record it will read.
partition 3:   [0 ... 118399][118400][118401][118402]  <- log end offset 118403
                            ^ committed offset 118400
lag = 118403 - 118400 = 3 records
The lag of a group is the sum over its partitions. Be careful about what it measures: records produced and not yet committed by the group. Records fetched and in progress count as lag too, since the offset is committed after processing.
The command line tool prints it per partition and is the baseline to compare any code against:
kafka-consumer-groups.sh --bootstrap-server broker:9092 --describe --group billingGROUP TOPIC PARTITION CURRENT-OFFSET LOG-END-OFFSET LAG CONSUMER-ID
billing order-events 0 91234 91234 0 billing-1-7a1f...
billing order-events 1 88001 88950 949 billing-1-7a1f...
billing order-events 2 90112 90112 0 billing-2-91c3...Partition 1 is behind by 949 records while the others are caught up. That uneven pattern points at a hot key or a slow consumer for that partition, and a total of 949 would hide it.
Compute it with the AdminClient
The AdminClient can fetch committed offsets for a group and the end offsets for the partitions, without being a member of the group, so monitoring does not trigger rebalances:
package dev.javahacks.kafka;

import org.apache.kafka.clients.admin.*;
import org.apache.kafka.clients.consumer.OffsetAndMetadata;
import org.apache.kafka.common.TopicPartition;

import java.util.HashMap;
import java.util.Map;
import java.util.concurrent.ExecutionException;
import java.util.concurrent.TimeUnit;

public class LagReader implements AutoCloseable {
    private final Admin admin;

    public LagReader(String bootstrapServers) {
        this.admin = Admin.create(Map.of(AdminClientConfig.BOOTSTRAP_SERVERS_CONFIG, bootstrapServers,
                AdminClientConfig.REQUEST_TIMEOUT_MS_CONFIG, "10000"));
    }

    public Map<TopicPartition, Long> lag(String groupId) throws ExecutionException, InterruptedException {
        Map<TopicPartition, OffsetAndMetadata> committed = admin.listConsumerGroupOffsets(groupId)
                .partitionsToOffsetAndMetadata().get(15, TimeUnit.SECONDS);

        Map<TopicPartition, OffsetSpec> latest = new HashMap<>();
        committed.keySet().forEach(tp -> latest.put(tp, OffsetSpec.latest()));
        Map<TopicPartition, ListOffsetsResult.ListOffsetsResultInfo> ends =
                admin.listOffsets(latest).all().get(15, TimeUnit.SECONDS);

        Map<TopicPartition, Long> lag = new HashMap<>();
        committed.forEach((tp, offset) -> {
            long end = ends.get(tp).offset();
            lag.put(tp, Math.max(0, end - offset.offset()));
        });
        return lag;
    }

    @Override
    public void close() {
        admin.close();
    }
}
Call it with the group id and print:
try (var reader = new LagReader("broker:9092")) {
    reader.lag("billing").forEach((tp, lag) -> System.out.println(tp + " lag=" + lag));
}order-events-0 lag=0
order-events-1 lag=949
order-events-2 lag=0Two details. The map only includes partitions the group has a committed offset for, so a brand new partition that no consumer has committed yet does not appear and silently drops out of the sum. For topics where that matters, list the topic's partitions with describeTopics and treat a missing committed offset as the earliest or the whole log. And the committed offset is only as fresh as the commit: a consumer that commits every five seconds reports lag in steps.
Export it as a Micrometer gauge
A gauge samples a value on demand, so register one per partition, tagged, and refresh the lag on a schedule instead of calling the broker on every scrape:
@Component
public class LagMetrics {
    private final LagReader reader;
    private final MeterRegistry registry;
    private final Map<String, AtomicLong> values = new ConcurrentHashMap<>();

    public LagMetrics(LagReader reader, MeterRegistry registry) {
        this.reader = reader;
        this.registry = registry;
    }

    @Scheduled(fixedDelay = 15_000)
    public void refresh() {
        try {
            reader.lag("billing").forEach((tp, lag) -> {
                String key = tp.topic() + "-" + tp.partition();
                values.computeIfAbsent(key, k -> {
                    AtomicLong holder = new AtomicLong();
                    Gauge.builder("kafka.consumer.lag", holder, AtomicLong::get)
                            .tag("group", "billing").tag("topic", tp.topic())
                            .tag("partition", String.valueOf(tp.partition()))
                            .register(registry);
                    return holder;
                }).set(lag);
            });
        } catch (Exception e) {
            registry.counter("kafka.consumer.lag.errors").increment();
        }
    }
}
Refreshing every 15 seconds keeps the load on the brokers trivial. The error counter matters: a monitor that fails silently looks like a group with no lag, which is the most dangerous false reading. Alert on the error counter too. The tags are bounded by the partition count, which is fine; do not tag with record keys or consumer ids, which would grow without limit. You do not always have to write this. The Kafka client itself exports a per consumer records-lag-max metric, and Spring Boot binds it to Micrometer for the consumers inside your own application. The external approach above is for monitoring groups from a separate component, or for a view of the whole group, including consumers written in other languages. Off the shelf alternatives are Kafka Exporter and Burrow, which compute lag from outside and expose it for Prometheus.
Alert on trend and time, not a number
A fixed threshold, say lag above 10,000, is wrong in both directions. A busy topic produces 10,000 records in a second, so the threshold fires constantly. A quiet topic with a stuck consumer might never reach it. The signals that work:
Growth. Lag that rises continuously for several minutes means consumption is slower than production. In PromQL:
deriv(sum by (group, topic) (kafka_consumer_lag)[10m:1m]) > 0
  and sum by (group, topic) (kafka_consumer_lag) > 1000
The second clause avoids paging for a tiny lag that is wobbling.
Time lag. What users feel is delay, not record counts. Estimate how long the backlog would take to drain at the current consumption rate:
sum(kafka_consumer_lag{group="billing"}) / sum(rate(kafka_consumer_records_consumed_total{group="billing"}[5m]))The result is seconds of backlog. An alert at "backlog above 5 minutes of work for 10 minutes" describes a real service level problem. For a more direct measure, compare the timestamp of the record being processed with the current time and export the difference as consumer.event.age; it needs one line in the handler and is the most honest definition of freshness.
Stalled consumption. Lag that is non zero and constant means the group is not consuming at all (a dead group, a paused container). Detect with changes(kafka_consumer_committed_offset[10m]) == 0 and lag > 0.
Zero lag is not always healthy. Lag of zero means the group has caught up with the log, which includes the case where nothing is being produced. If the upstream producer has crashed, every consumer looks perfect. Pair lag with the produce rate, and alert when a topic that normally sees traffic goes quiet.
Reading the pattern
| Pattern | Likely cause |
|---|---|
| Lag grows on all partitions, steadily | Consumers too slow or too few for the traffic |
| Lag grows on one partition | Hot key, a stuck record, a slow consumer instance |
| Lag spikes then drops, repeatedly | Rebalances; look at the group coordinator logs and max.poll.interval.ms |
| Lag is flat and non zero | Consumers stopped or paused; check the group's state and member list |
| Lag jumps after a deploy and recovers | Normal cost of a restart and rebalance, watch its duration |
| Lag zero, then sudden large jump | A burst from the producer, or a replay that reset offsets |
The group's state is worth including in a check. admin.describeConsumerGroups returns the state (STABLE, PREPARING_REBALANCE, EMPTY, DEAD) and the members; a group that is EMPTY with lag has no consumers at all.
Test the reader
The lag arithmetic is simple and the edge cases are the risk, so test them against a real broker: produce a known number of records, consume a known number and assert the difference.
@Test
void lagIsTheDifferenceBetweenEndAndCommittedOffsets() throws Exception {
    produce("order-events", 10);
    consumeAndCommit("billing", "order-events", 4);

    var lag = reader.lag("billing");

    assertThat(lag.values().stream().mapToLong(Long::longValue).sum()).isEqualTo(6);
}
Add a case for a partition with no committed offset, which is the one the first implementation silently ignores.
When this does not apply
Lag only means something for consumers that commit to Kafka. A consumer that stores offsets elsewhere, for example in a database for exactly-once processing, reports no committed lag to Kafka, and you must compute it from your own store. For topics read by many independent groups, track each group separately and alert only on the ones that matter. The references are the Kafka documentation on monitoring and the AdminClient Javadoc.