How the JVM Works From Bytecode to Machine Code Step by Step
Follow Java code from source to bytecode, class loading, interpretation and JIT compilation, and see why the JVM is slow at first and fast later.
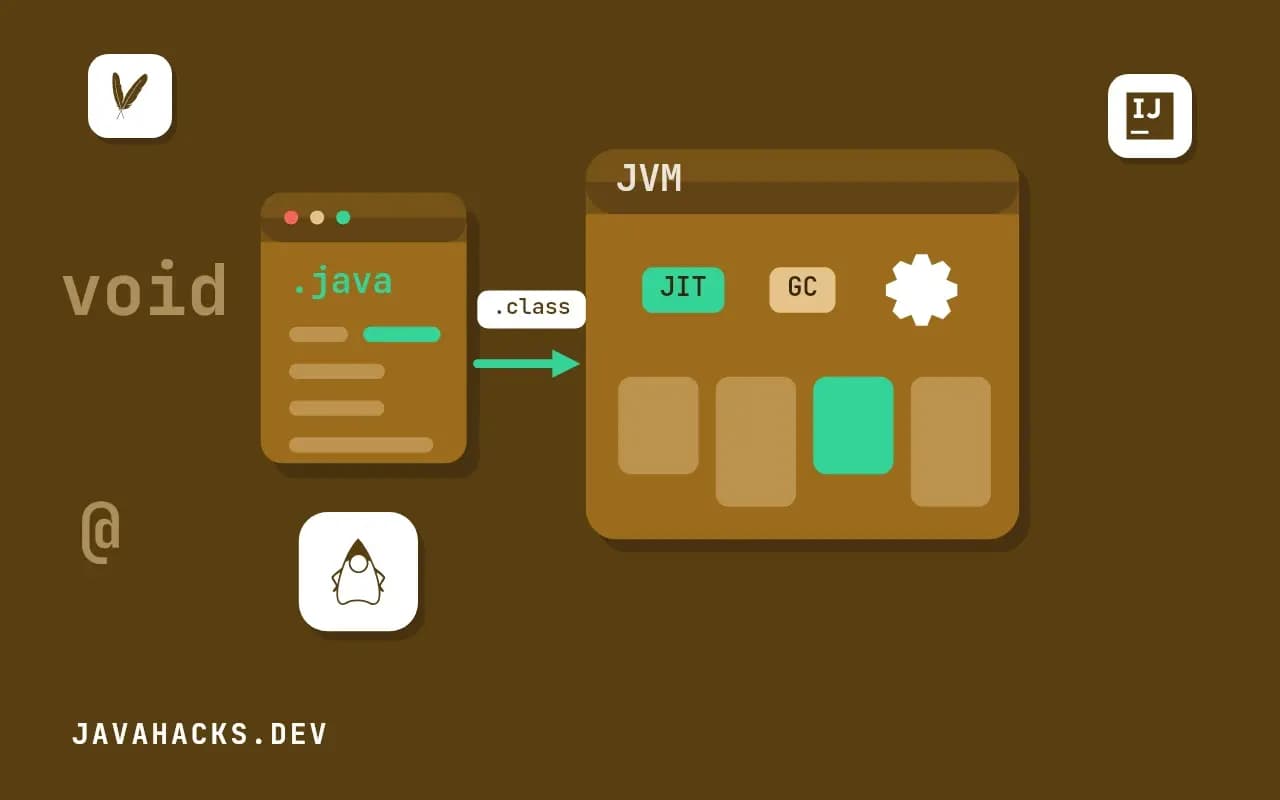
A Java program is not run by the processor. It is run by another program, the Java Virtual Machine, which reads a compact instruction format called bytecode and decides, at run time and method by method, whether to interpret it or turn it into native machine code. That one design choice explains most of what surprises people about Java: the same jar runs on a laptop and a server, the first request is slower than the thousandth, the memory footprint is larger than the heap you configured, and a benchmark that looks fast in main is not.
This post follows a four-line program through the whole pipeline with real tool output: source to bytecode, class loading and linking, interpretation, then compilation. Commands ran on JDK 17.0.1; the pipeline is the same in Java 25.
Source to bytecode
Start with a program small enough to read its bytecode in full:
public class Add {
    static int add(int a, int b) {
        return a + b;
    }

    public static void main(String[] args) {
        int total = 0;
        for (int i = 0; i < 3; i++) {
            total = add(total, i);
        }
        System.out.println(total);
    }
}
javac Add.java writes Add.class. The javap tool disassembles it:
javac Add.java
javap -c -p Add static int add(int, int);
Code:
0: iload_0
1: iload_1
2: iadd
3: ireturn
public static void main(java.lang.String[]);
Code:
0: iconst_0
1: istore_1
2: iconst_0
3: istore_2
4: iload_2
5: iconst_3
6: if_icmpge 21
9: iload_1
10: iload_2
11: invokestatic #7 // Method add:(II)I
14: istore_1
15: iinc 2, 1
18: goto 4
21: getstatic #13 // Field java/lang/System.out:Ljava/io/PrintStream;
24: iload_1
25: invokevirtual #19 // Method java/io/PrintStream.println:(I)V
28: returnRead add first. The JVM is a stack machine: iload_0 and iload_1 push the two arguments onto an operand stack, iadd pops both and pushes the sum, ireturn returns the top. There are no registers in the instruction set, which is what keeps bytecode independent of any processor. The main method shows a loop as plain jumps: if_icmpge 21 leaves the loop when i >= 3, goto 4 goes back. The #7 and #13 are indexes into the constant pool, the table of names and literals every class file carries.
The class file starts with a header the JVM checks before anything else. javap -v Add shows major version: 61, which is Java 17. A class compiled for a newer version than the running JVM is refused with the error in UnsupportedClassVersionError.
Loading, linking and initialization
The JVM does not read every class at startup. A class is loaded the first time something needs it, in three phases:
- Loading. A class loader finds the bytes (from the JDK's own image, a jar or a directory) and builds the in-memory representation in metaspace. The loaders form a parent-first chain: the application loader asks the platform loader, which asks the boot loader, and only if all refuse does the application loader look in your classpath. That order is why you cannot replace
java.lang.Stringby putting your own on the classpath. - Linking. The bytecode verifier checks that the class is well-formed: stack depths match, types are consistent, jumps land on instruction boundaries. Then static fields get default values, and symbolic references are resolved lazily.
- Initialization. Static initializers and static field assignments run, once, before the first use of the class.
You can see this laziness. Run the program with class-load logging and count the lines that mention your class:
java -Xlog:class+load -cp . Add | grep -c "Add "
java -Xlog:class+load -cp . Add | wc -l1
405The program loaded 405 classes to print a single number, almost all of them JDK classes from the shared archive, and Add exactly once. When a class is missing at the moment of first use, you get the exceptions explained in ClassNotFoundException and NoClassDefFoundError, and the memory those 753 classes occupy is the topic of JVM memory areas.
Interpreting first, then compiling
The interpreter executes the bytecode directly, one instruction at a time. It starts instantly and runs slowly. While it runs, the JVM counts how many times each method is called and how many times each loop jumps backward. When a count crosses a threshold, the method is queued for compilation to machine code, which happens on background compiler threads while the program keeps running.
The difference is not subtle. A tiny method called twenty million times per round, timed on a 10-core laptop:
interpreter only (-Xint):          467 ms per round
default (interpreter, C1, C2):      13 ms per round after warm-up
That is a factor of 35 from compilation alone. There are two compilers. C1 compiles quickly with modest optimization and inserts profiling counters. C2 takes its time and uses the recorded profile, which types reached which call, which branches were taken, to inline aggressively, remove checks that were never needed and keep objects out of the heap entirely. The step-by-step account of the tiers, with -XX:+PrintCompilation output, is in tiered compilation with C1 and C2.
Compiled code is a bet on the profile. If the bet fails, a new subclass is loaded or a rare branch fires, the JVM throws the compiled code away and goes back to the interpreter, then recompiles with the new facts. This is called deoptimization, and it is why Java can optimize more aggressively than an ahead-of-time compiler, which has to be right without seeing the program run.
Garbage collection runs alongside
While methods run, the heap fills with objects. The garbage collector reclaims whatever is no longer reachable from a root (a stack variable, a static field, a live thread). The program never frees anything. Which collector runs, and what pauses it causes, depends on the collector you choose: generations, regions and pauses and G1 against ZGC and Shenandoah cover that choice. For this post, the relevant fact is that collection and compilation both compete with your threads for CPU, and the JVM starts several of each.
See the whole pipeline in one run
Combine the previous tools on one process and you can watch each stage in a log:
java -Xlog:class+load:file=load.log \
     -Xlog:gc:file=gc.log \
     -XX:+PrintCompilation \
     -cp . Add
load.log fills first and quickly. PrintCompilation stays empty for a program this short, because nothing runs often enough to reach a threshold: the whole life of Add happens in the interpreter. That is the point of the next section.
What warm-up means in practice
The pipeline has a cost curve. In the first seconds of a process most code is interpreted, classes are still loading and the compilers are busy, so throughput is low and latency is high. Then the hot methods compile and the curve flattens. Consequences you will meet:
- Benchmarks. A microbenchmark must warm up, then measure. A loop in
mainthat times itself measures the interpreter, C1, the compile pauses and sometimes nothing at all, when C2 deletes work whose result is unused. JMH exists to handle this. - Deployments. A service sent full traffic the moment it starts shows slow requests for the first minute. Send warm-up traffic before the load balancer does, or ramp up gradually.
- Short-lived processes. A command-line tool or a function that runs for two seconds lives entirely in the slow phase. Class Data Sharing, native images and the ahead-of-time cache work in JDK 24 and later move work from run time to build time. See why Quarkus starts fast.
- Memory. The JVM's footprint is more than the heap: metaspace, the code cache for compiled methods, thread stacks and direct buffers all count.
Where this model stops
This account describes HotSpot, the JVM in OpenJDK and most distributions. Other runtimes differ: GraalVM's native image compiles ahead of time with no JIT, and Android does not run JVM bytecode at all. Language features also evolve the model, which is why the language and the platform are covered side by side in the modern Java guide. The authoritative reading is the Java Virtual Machine Specification and the HotSpot documentation.